Risk factors
Young drivers and their passengers are at far greater risk of death on the roads than more experienced drivers: 26 percent of all car user deaths are young people aged 17 to 24. A number of factors contribute to this increased risk, including:
- Alcohol and drug use
- Night-time driving or poor conditions
- Older, less-safe vehicles
- Overtaking blind
- Inappropriate speed
- Risk taking
- Poor assessment of hazards
- Peer pressure from passengers
- Mobile phone usage
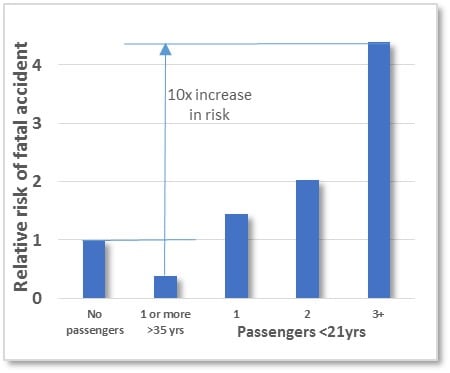
Of all the risk factors contributing to young driver road deaths, peer pressure is perhaps the most significant: the chart above shows the relative risk of fatal accident in relation to the number and age of passengers.
Feedback for young drivers
In virtually all circumstances, inappropriate speed plays a significant role in the cause of accident. Typical characteristics of young driver accidents include:
- There are often three or more casualties involved
- Collisions are often single vehicle so involve no other road user
- Accidents often occur on bends, particularly on rural roads
- Vehicles often skid and, in some cases, overturn
- Vehicles often leave the road and, in many cases, hit a roadside object or enter a ditch
- In many instances, these serious accidents occur at speeds below the statutory limit, particularly on rural roads.
At Quartix we use a combination of risk factors to monitor and provide feedback to young drivers, including: speed in relation to the road being driven , acceleration, braking, the time of day and mileage being driven. A summary is given in the following sections.
Young driver accidents often occur on country roads, with no other vehicles involved. Our SafeSpeed database is purpose-designed to measure risk on rural roads and help prevent this type of accident.
Watch this video
The statutory speed limit is not an effective measure of accident risk on rural roads.
Using speed distributions to determine accident risk
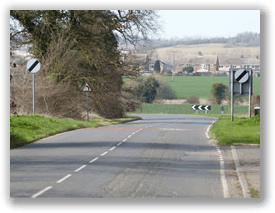
The photograph shows a typical rural road, with 60 mph speed limit. Telematics data from our fleet customers shows that virtually no professional drivers exceed the speed limit along this stretch of narrow, badly maintained road which has two very sharp bends.
Safespeed database
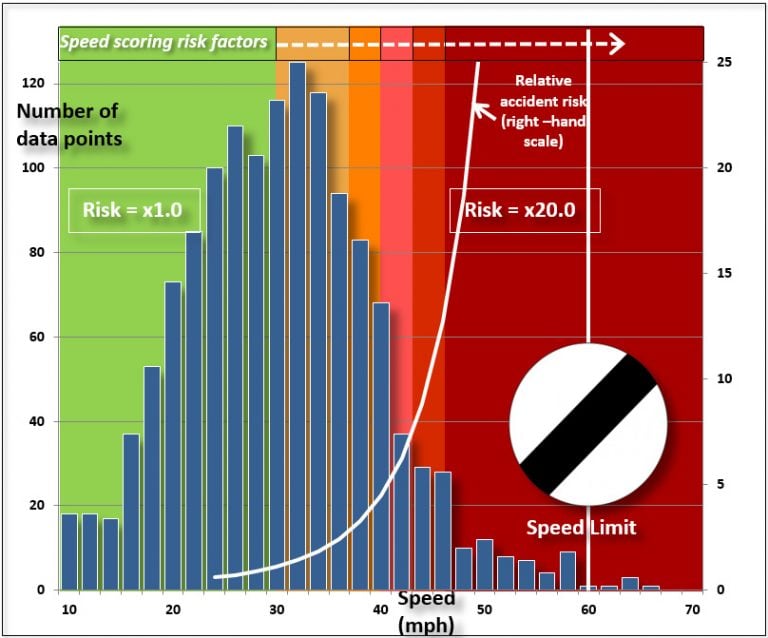
The graph shows a speed distribution for this route from our “SafeSpeed” database. This unique and invaluable tool presents more than one million road speed distributions for the UK road network. The risk of accident increases exponentially as speed increases beyond the mean of all free flowing traffic. This curve is shown on the graph, as are the risk factors applied to each data point. The significant points from this graph are:
- The statutory speed limit is not an effective measure of accident risk on most rural roads.
- By using relative speed scoring, speed risk can be properly assessed and young drivers can be encouraged to drive more carefully on rural roads.
The SafeSpeed database from Quartix is a powerful tool for the assessment of accident risk from speeding – particularly on rural roads where the statutory speed limit is of little use.
A detailed explanation and presentation of the SafeSpeed database, together with an explanatory video, are shown here.
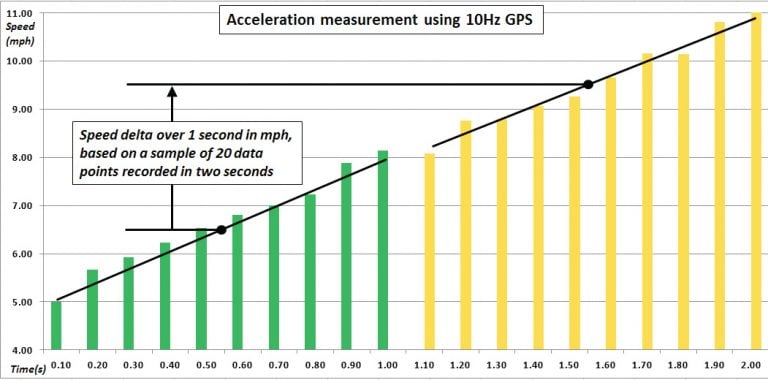
Acceleration and braking scores are calculated every second
The acceleration and braking of each driver is monitored every second of each journey, using speed data gathered from the GPS receiver ten time each second. By using noise reduction algorithms across a large number of data samples it significantly reduces transient errors caused by multipath and other known GPS characteristics.
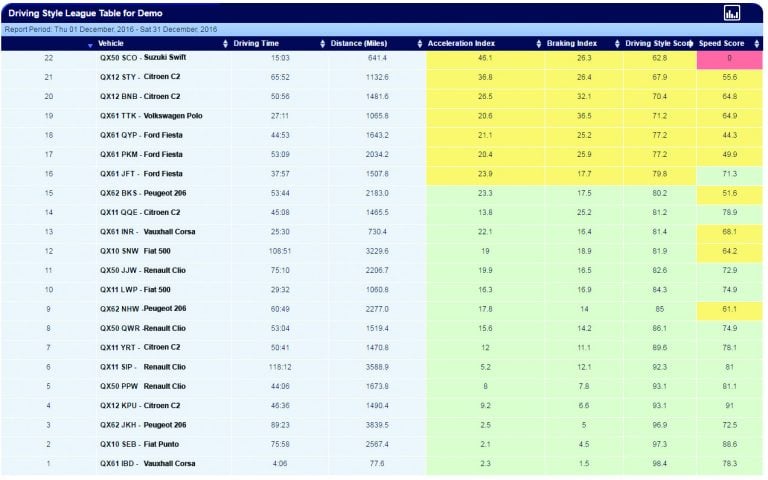
Driving style exception reports
These reports can be presented in the form of a league table, as shown below. They can be sorted in order of overall driving score or of any of the individual components of the score, and can be compiled across any time period. From the registration or policy number in the left-hand column the user can drill down to detailed data on the individual’s driving using a range of options, including the daily analysis report, the young driver’s own dashboard and a display showing trends in driving score.
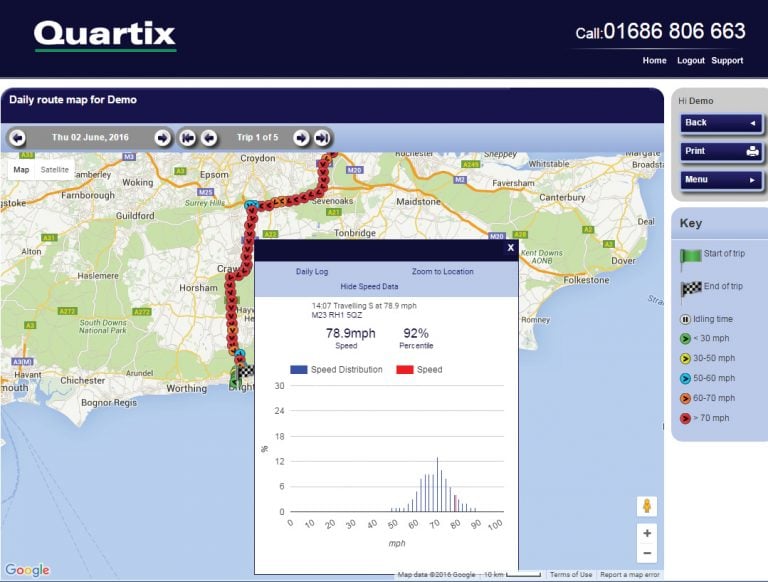
Route and speed report
Clicking through from any extreme speeding or acceleration/ braking event shown on the daily analysis report takes the user directly to the particular journey. Each data point is colour coded for speed and provides speed distribution information to give a much more detailed view of how the young driver is driving.
Driving style exception reports
Driving style scores are measured continuously across all young driver vehicles, and reports can be generated showing those with the lowest scores. Driver scores are calculated based on a combination of:
- Acceleration
- Braking
- Relative speed scoring
- Time of day
Daily analysis report
In one simple graphical report this gives a quick overview of speeds and usage patterns (including time of day), together with the corresponding acceleration and braking profiles. A breakdown of the acceleration, braking and speeding scores is shown together with links from the graphs to the actual map location of any speeding, braking or acceleration incidents.