See for yourself how Quartix works with our fully interactive real-time demo.
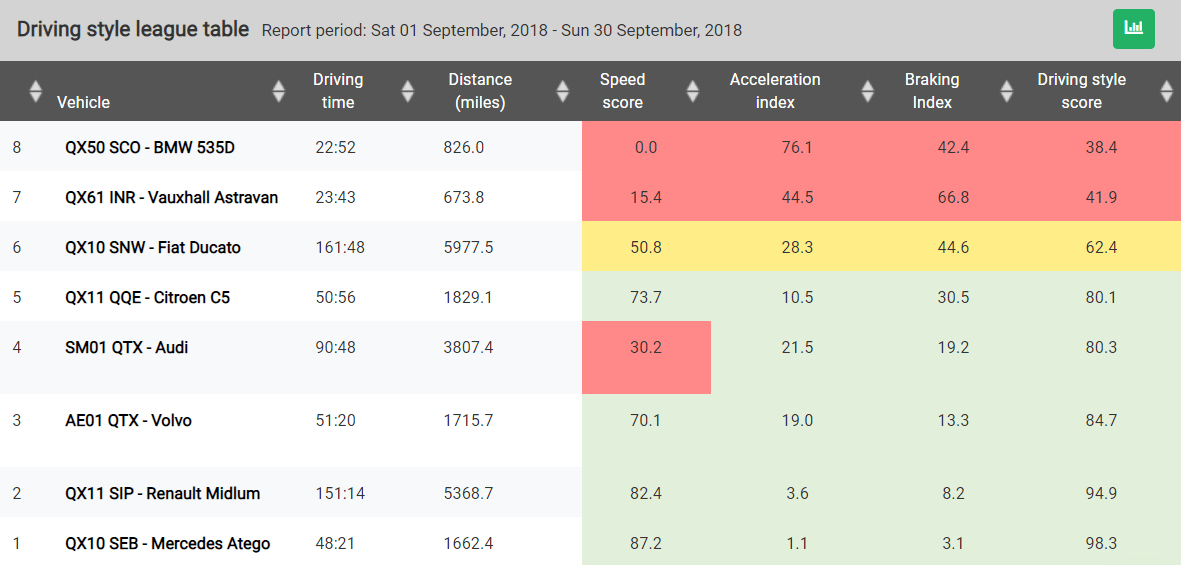
Driver behaviour scores
Compare driver behavior scores across your entire fleet. Each driver is given a score based on their driving profile. Those who are taking too much risk will stand out on the Driver League Table in red. The best drivers will appear in green, and those in between will be amber.
The reports allows you to see acceleration and braking, and a simple click will take you to the exact location on Google maps where the incident took place, allowing you to investigate further.
Monitoring and improving driving style can save up to 15% in fuel savings and reduce risk of accident and injury. Training your staff to drive safely is easy with Quartix. Our range of reports, including speed distribution and acceleration / braking profiles, give you all the data you need to influence and encourage safe, economical driving behaviour.

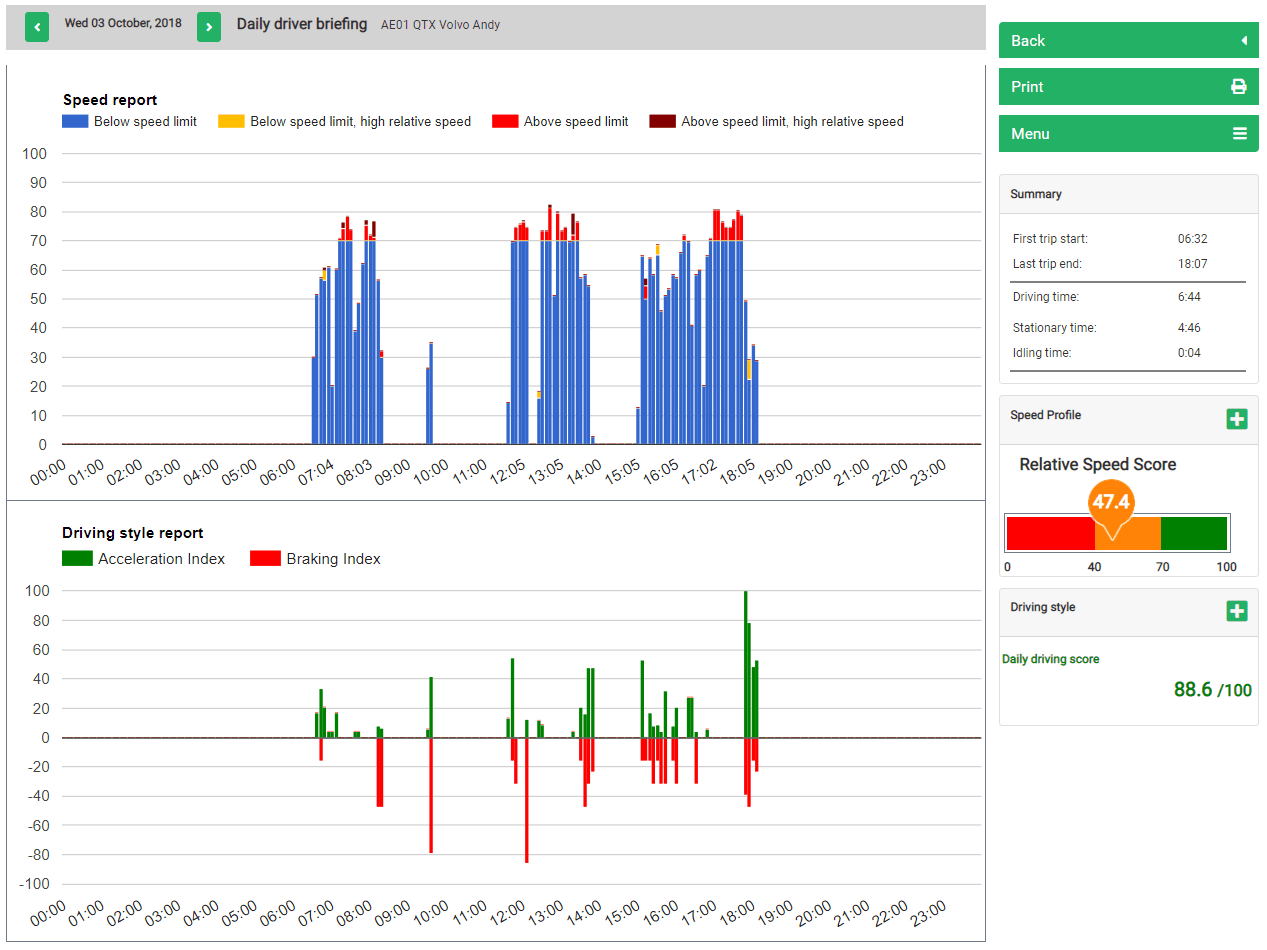
Daily driver briefing
Work with your drivers to improve driving styles and use data to show parts of their journey where they “lost” driver points, so they can review actual data and learn from experience.
The driver briefing report shows speeds for the day plus acceleration and braking profiles. To explore in detail the actual location of speeding or harsh braking incidents, it’s simple to click on the graph bars to see the Google Street View.
- Monitor speed, acceleration and braking profiles
- Compare driver behaviour scores across a group of vehicles or the whole fleet
- Save on fuel and reduce risk of accident
Relative speed scores
A high rate of fatal accidents happen on rural roads, despite drivers rarely exceeding these roads’ legal speed limit. Quartix provides a better measurement of safe speeds for your drivers; The Relative Speed Score uses contextual data to give a complete picture of their performance.
By measuring the speed of thousands of vehicles across the country, Quartix has designed the SafeSpeed database. Any driver’s speed, at any location, can be compared to the average speed of other vehicles that have travelled on the same section of road.
The Relative Speed Score offers invaluable insight into driver safety. It allows you to coach your drivers more effectively, improve their driving behaviour and prevent accidents.
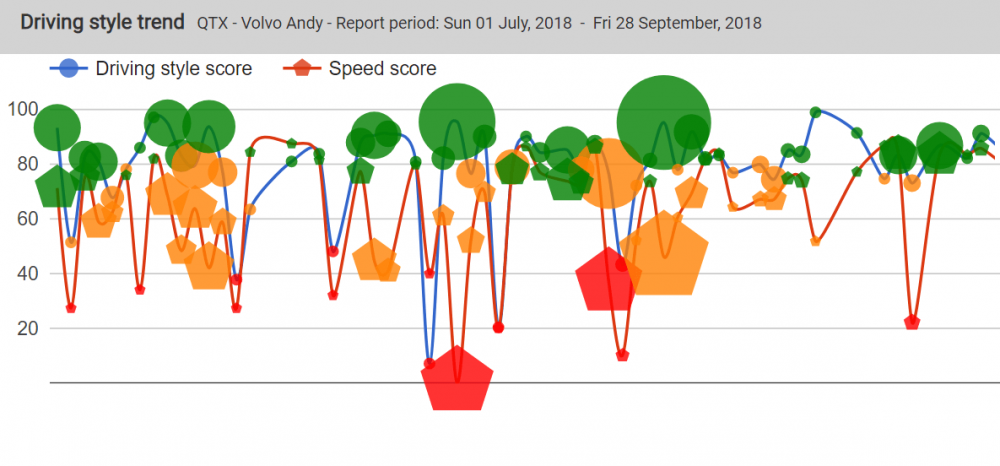
Driving style trend
Quickly identify any driving style concerns that may need immediate attention. Working with your drivers, you can identify if their style is improving over time – over the course of a month you might expect to see an impact – and incorporate this into performance reviews or reward schemes to encourage better driving.
Looking at the driving style over a month or longer, allows you to see if the style if consistent and spot any trends such as for example, specific locations or specific days where speed scores are worse.
The data can be exported into a csv file for further analysis.
Mobile App for drivers
Grant individual drivers access to their own driving style reports via the Mobile app, without giving them access to other drivers’ information. This encourages drivers to see their own scores and performance at the end of each day.
The driver will be able to see the speed they travelled at different points in the day, and they can see the acceleration and braking index for that same time period.
The Daily Driver Score is also clearly visible, so the driver can access their style of driving at the end of each day, or go back over previous days in the week to see how their driving has improved.
The app is free to download and there is no limit to the number of people who can use the app per account.
Need to speak to one of our experts?


We’ll help you decide which vehicle tracking option is right for you