Saving the lives of young drivers on rural roads
Most young driver deaths occur on rural roads, and yet these roads represent less than half the mileage covered. Inappropriate speed leading to loss of control is one of the main factors: young driver accidents often involve no other vehicles.
The appropriate speed for any given rural road depends on the context: layout, width, surface, contour, conditions and time of day. In most cases the appropriate speed would be below the speed limit, which is typically 60mph. Insurance telematics programmes which use the statutory limit as the principal scoring benchmark may fail to identify drivers who are at risk of serious accident or death on country roads. Quartix is the first telematics company in the UK to offer contextual speed scoring.
This section of our website describes the use of contextual speed scoring and how, in conjunction with early intervention with young drivers, it modifies behaviour, saves lives and reduces loss ratios.
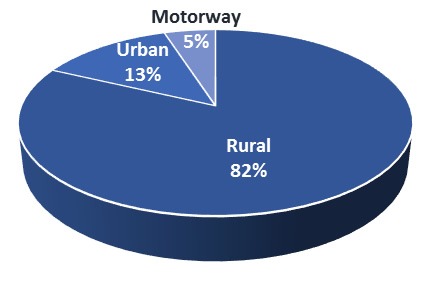
Young driver deaths in the UK by road type 1
Rural road deaths
Rural roads in the UK account for 82%1 of young driver motor accident deaths, for just 40% of the distance driven.
Young drivers are particularly at risk on rural roads because they drive at night more often than older drivers and they have less experience of this type of road. When they have a serious accident, there can be multiple casualties, even without the involvement of another vehicle. It’s not unusual for a car to leave the road or roll – particularly on bends or in the dark.
Fatal accidents also occur at road junctions and through high risk manoeuvres, such as overtaking on blind corners.
Telematics systems must provide insurers with the tools necessary to identify high-risk driving at an early stage and modify behaviour through early intervention. Contextual speed scoring is a key element of this.
Vehicle speeds at rural accident sites
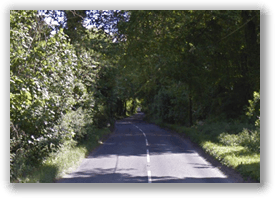
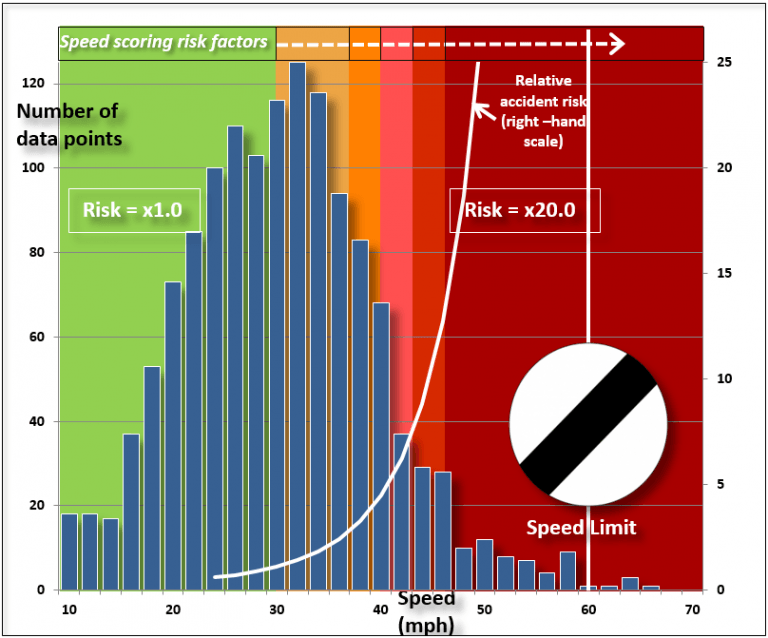
The road pictured was the site of a fatal accident in April 2016. It is a typical rural road and is subject to the national speed limit of 60mph. The chart uses Quartix telematics data to show the distribution of speeds of road users at the accident location.
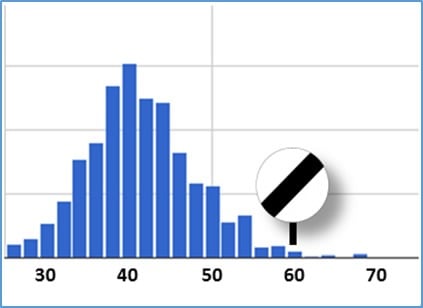
Speed distribution on 0.7km segment of road at accident site.
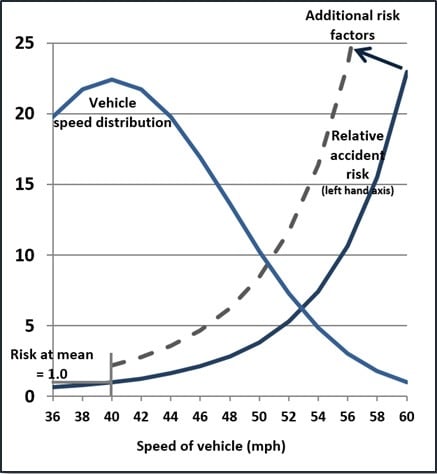
Relative risk of accident in relation to the variance from the mean speed of free-flowing traffic3
Determining risk of accident using contextual speed scoring
Various studies3 have shown that the risk of a serious accident, where there are casualties involved, increases exponentially as speed increases beyond the mean speed of free-flowing traffic. Using the conclusions of the study referenced, the relative risk of accident rises from 1.0 at the mean speed, to more than 20x by the 95th percentile point of the vehicle speed distribution. In this case that speed would still be below the limit. The graph relates this to the data from the accident site.
Additional risk factors
Additional risk factors for young drivers include: lack of experience or poor hazard perception; night-time driving; poor weather conditions or visibility; and peer pressure. The last of these is perhaps the most significant, as the graph shows.
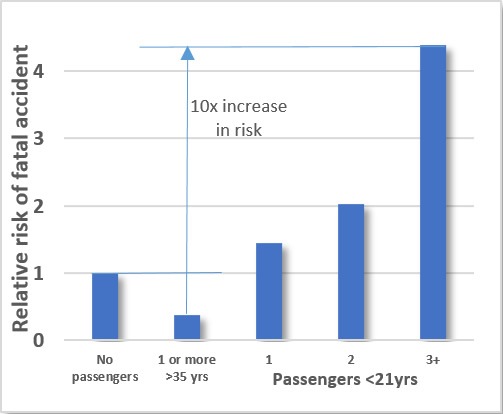
Relative risk of accident in relation to the number and age of passengers
There is a tenfold difference in relative risk of fatal accident between a car full of young passengers and a car with at least one adult over 35 present
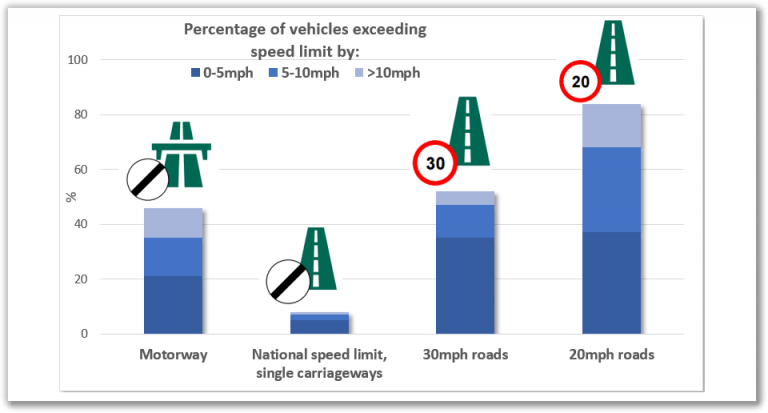
Just 8% of road users exceed the 60mph statutory speed limit on single carriageways, and only 3% of road users exceed it by more than 5mph5.
Rural speed limits are a very poor benchmark for accident risk
Very few road users exceed the speed limit on rural roads. In fact, just one driver in thirty exceeds the national limit by more than 5mph. And yet most telematics systems still use it as the basis for driver scoring. This could fail to identify those at risk of accident. It is inappropriate, rather than excess, speed which is the cause of accidents, and determining this requires a scoring matrix which uses the road context, based on data analysis. Average free-flow speeds on rural roads are up to 20% lower, in relation to the speed limit, than they are on other road types5.
Using data from Crashmap6 as a reference, the B3400, which runs through Overton (see opposite), has seen 5 fatal accidents in the past 18 years: two outside the village on each side and one in the centre. The speed limit on the open stretches has been reduced to 50mph as a consequence, and yet telematics data from our systems shows that the mean speed is almost 20% below the limit and that only 5% of all traffic exceeds it, indicating the importance of contextual speed scoring – even in cases where the limit has been updated.
Contextual speed scoring: the SafeSpeed Database
Quartix’s SafeSpeed Database processes more than 30 million data points per day from fleet drivers, updating speed distributions as it allocates each point to one of over two million road segments on a real-time basis.
Every single data point for each young driver is assessed against these distributions and scored in relation to other road users on the same stretch of road. This overcomes the limitations and problems associated with use of the statutory limit, discussed earlier.
As a practical example, the graph opposite shows both the recorded speed distribution, from our SafeSpeed database, and the contextual speed scoring risk factors used by Quartix for the road depicted above it.
Watch a short video explanation of the SafeSpeed database, together with a short journey along this road
The scoring of each data point reflects the relative risk of accident, in accordance with the published findings of the reports referenced below3.
Improving loss ratios and saving lives
Quartix’s contextual speed scoring system is the result of a 6-year development programme7, and provides young drivers and insurers with real-time feedback based on speed in the context of each road. By using this data insurers engage directly with either the driver or his parents to encourage a change of driving behaviour and reduce the likelihood of serious accident. Knowing that his driving is being compared with other road users, and not just the speed limit, can also help a driver in resisting the peer pressure from young passengers that gives rise to some of the most serious accidents.
References
- Facts on young car drivers. Department for Transport, National Statistics, June 2015
- Country roads revealed as Britain’s deadliest: Department for Transport, Oct 2015.
- Travelling speed and the risk of crash involvement on rural roads. Road Accident Research Unit, Adelaide University, July 2011
- Teen driver risk in relation to number and age of passengers. AAA Foundation, May 2012
- Free flow vehicle speeds in Great Britain. Department for Transport, June 2016
- Crashmap.co.uk: copyright and published by Insight Warehouse Ltd.
- The right speed for the road: Quartix pitches in with contextual speed scoring. M Logistics, March 2012
Founded in 2001, Quartix Ltd is one of Europe’s leading providers of telematics systems, software and analysis tools. It has design teams based in Cambridge, Leatherhead and Southampton, and an insurance centre in Newtown, Mid Wales. More than 200,000 Quartix telematics systems have been installed in the UK.